Hello.
I'm Mochizuki, and I always answer numerical questions in the Anonymous Question Box.
Since you wanted to see the graph this time, I will answer here instead of using the question box.
(Because images cannot be pasted in the question box)
Here is the question you asked.
"Now that campaigns are overlapping, I would like to see a graph of the number of dates nationwide."
This is Mochizuki's own interpretation, but I thought that he was wondering how much the number of dates increased during the campaign, so I created a graph of the number of dates in March and April.
By the way, the current campaign is
It's wonderful ♥ reverse offer campaign
Period: 3/18 ~ 4/17
Kanto joint 5th free campaign
Period: 4/1 ~ 5/31
West Japan transportation expenses "almost" full refund!Bleeding Service Thanksgiving! !
Period: 3/31 ~ 4/30
Here are the three.
And here is the graph.
↓ ↓ ↓
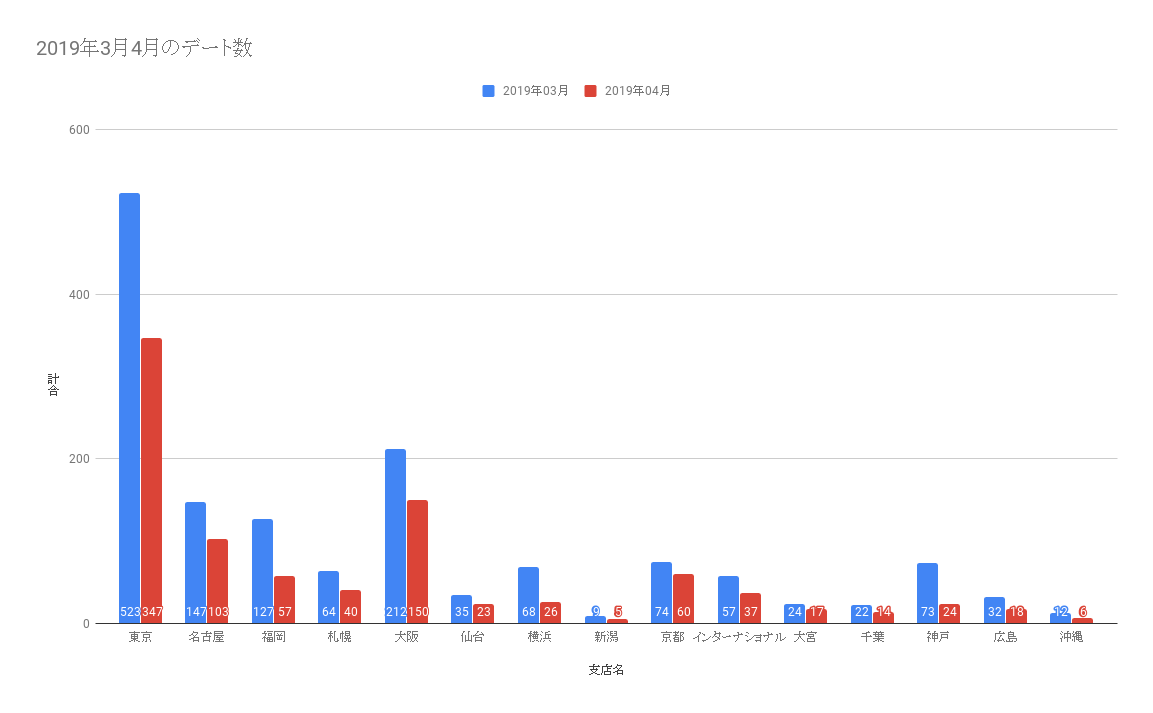
April has just started, but most branches are already more than halfway through March.
It's super amazing. . .
In this table, even if the offer was made in March, if the date date is in April, it will be added to April.
Probably, the reverse offer campaign will start on March 3th, so it will take a few days to see how it looks after receiving it, and it will take a few days to actually make an offer. I wonder if it's a date.
It's been less than a week since the East Japan and West Japan campaigns started, and the number of offers in the East and West campaigns will continue to increase.
Thank you very much.
thank you all!
※ Postscript 2019/4/7
I will upload the graph that I received in your comment.
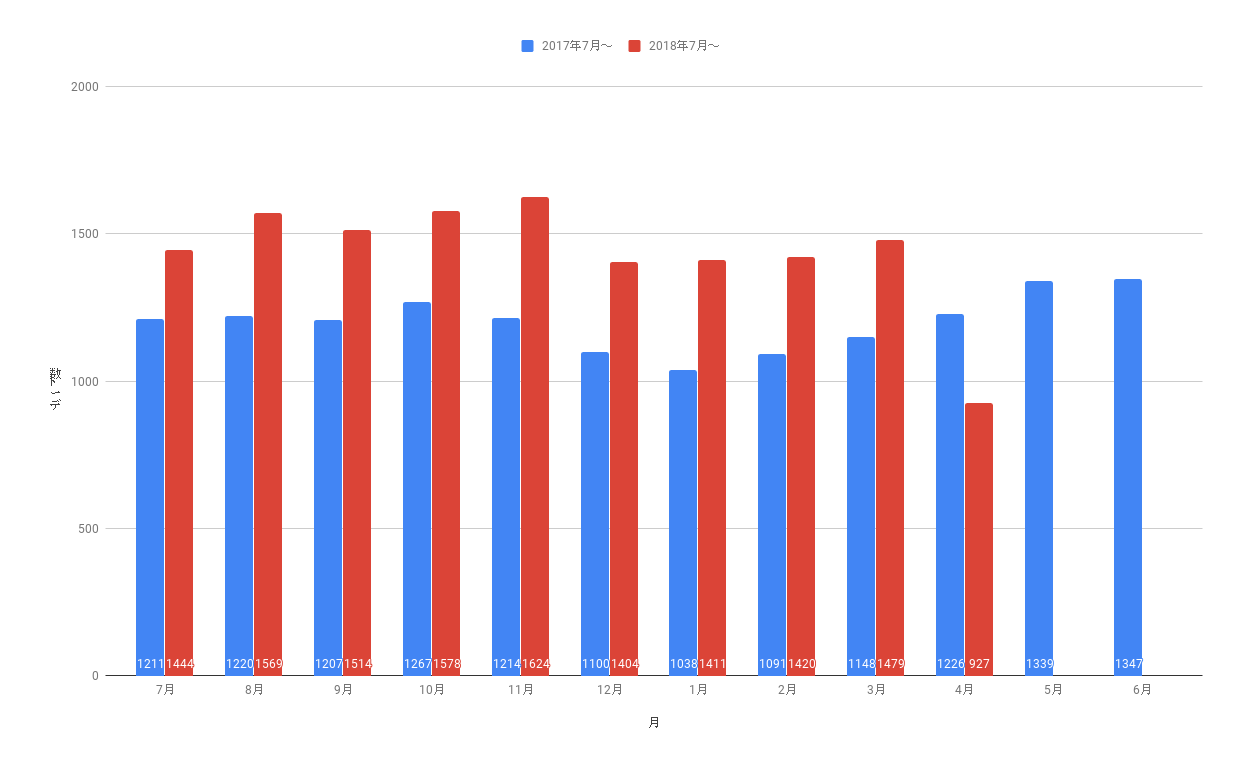

April is the busiest month of the year. Compared to March,
Please provide a comparison graph of last year and this year.
Mr. Ace
Thank you for your comment!
It's strange that it will start in July due to the system, but I added the graph to the text as an addendum.
(I thought you might be interested in the number of dates by month, so I did not by branch but by month for all branches total)
Blue from July 2017 to June 7
Red is from July 2018.
Figures for April 2019 are as of April 4.
The number of offers decreases from December to February, and gradually increases from March.
Compared to blue, red has an average increase rate of 128%,
Comparing the number of dates in April 2018 and April 4, it has already reached 2019% as of April 4th.
Mr. Mochizuki
Thank you for sharing your valuable information.I will ride on this success as a member.